This past January I was able to attend rstudio::conf 20201 in San Francisco. I was there for the full week, taking the Applied Machine Learning workshop and attending as many of the main conference program sessions as possible.
Here is a collection of highlights/takeaways from the conference:
- Debugging with
browser() - Technical Debt
- Tunneling with tidyeval
ggplot + NULLplumberfor building APIspinspackageboostraplibpackagerolldownoutput
Debugging with browser()
Jenny Bryan’s Object of Type Closure Is Not Subsettable was one of my favorite talks at the conference. My debugging practices have been … crude, at best. I wish I would have taken the time to learn about some of the tools she covered a long time ago.
Moving forward I’ll definitely be using browser(). When you drop it in inside a function, you can step through each call in the stack until it fails or succeeds. Along the way you can interactively update objects in the function environment to test fixes.
An example:
## define our function
fix_me <- function(.data) {
  x <- head(.data)
  y <- colSums(x)
  x[which.max(y),]
}

## try it with a data.frame
fix_me(mtcars)## mpg cyl disp hp drat wt qsec vs am gear carb
## Datsun 710 22.8 4 108 93 3.85 2.32 18.61 1 1 4 1## now try it with a vector
## doesn't work :(
fix_me(1:3)## Error in colSums(x): 'x' must be an array of at least two dimensions## add in call to browser() to see where it breaks
fix_me <- function(.data) {
browser()
x <- head(.data)
y <- colSums(x)
x[which.max(y),]
}
## run again to prompt browser
fix_me(1:3)## add in logic and messaging for dim check
fix_me <- function(.data) {
if(is.null(dim(.data))) {
stop("Your argument to `.data` must have at least 2 dimensions (columns and rows).")
}
x <- head(.data)
y <- colSums(x)
x[which.max(y),]
}
## still doesn't work :(
## but now it at least issues a message!
fix_me(1:3)## Error in fix_me(1:3): Your argument to `.data` must have at least 2 dimensions (columns and rows).## and this still works!
fix_me(mtcars)## mpg cyl disp hp drat wt qsec vs am gear carb
## Datsun 710 22.8 4 108 93 3.85 2.32 18.61 1 1 4 1Object of type ‘closure’ is not subsettable - Jenny Bryan

Technical Debt
Gordon Shotwell’s talk might have been the least technical and most important talk I saw at rstudio::conf. Technical debt abounds. There’s no doubt that my own development practices have led to more work for folks (including myself) down the line. It’s easy to take shortcuts in documentation, testing, and up-front efforts when scoping a project. It’s even easier to be cynical or blame a former maintainer (including yourself) for these shortcomings. But as Gordon pointed out, technical debt is a good sign … if there is a motivation to salvage, refactor, or otherwise optimize a codebase, then it means the underlying ideas hold value. The talk outlined a number of ways to avoid and/or remedy technical debt. One suggestion: build tools that are fun to use. Gordon gave the example of R markdown’s ability to give new users two very important features:
- Ease-of-use
- Path to mastery
Technical Debt is a Social Problem - Mr. Gordon Shotwell
Tunneling with tidyeval
Lionel Henry’s talk reviewed the history, design, and current features tidyeval (i.e. masking) in R. The new feature that resonated most with me was the “tunneling” syntax with {{ variable }}.
The code below outlines a simple use-case where we want to use dplyr syntax in a function that can accept bare variable names as arguments. This example function (most()) will try to find the maximum value for a given variable, stratified by a category:
## make sure dplyr is loaded
## NOTE: dplyr includes the starwars dataset
library(dplyr)

## define function *without* tunneling
most <- function(.data, var, by) {
  .data %>%
    group_by(by) %>%
    summarise(max(var, na.rm = TRUE)) %>%
    arrange(desc(var))
}

## this should produce an error ...
most(starwars, height, species)## Error: Column `by` is unknown## try defining the function with tunneling
most <- function(.data, var, by = NULL) {
.data %>%
group_by({{ by }}) %>%
summarise(max({{ var }}, na.rm = TRUE)) %>%
arrange(desc({{ var }}))
}
## still getting an error? ...
most(starwars, height, species)## Error in ~height: object 'height' not found## make sure we're passing in tunneled name for the summarise variable we create
most <- function(.data, var, by = NULL) {
.data %>%
group_by({{ by }}) %>%
summarise({{ var }} := max({{ var }}, na.rm = TRUE)) %>%
arrange(desc({{ var }}))
}
## works !
most(starwars, height, species)## # A tibble: 38 x 2
## species height
## <chr> <int>
## 1 Quermian 264
## 2 Wookiee 234
## 3 Kaminoan 229
## 4 Gungan 224
## 5 Kaleesh 216
## 6 Pau'an 206
## 7 Human 202
## 8 Droid 200
## 9 Besalisk 198
## 10 Cerean 198
## # … with 28 more rowsIn the Q&A Lionel clarified that the tunneling syntax meant to make tidyeval easier for folks to use … and will not necessarily supersede or replace the existing quo, enquo, !!, etc features.
Interactivity and Programming in the Tidyverse - Lionel Henry

ggplot + NULL
I didn’t know that adding NULL to a ggplot2 layer would produce the same plot as if it weren’t added at all:
library(ggplot2)

p <-
  ggplot(msleep, aes(name, sleep_total)) +
  geom_col() +
  coord_polar()

q <-
  ggplot(msleep, aes(name, sleep_total)) +
  geom_col() +
  coord_polar() +
  NULL

all.equal(p,q)## [1] TRUEDewey Dunnington pointed this out in the context of tips for programming with ggplot2. As an example, if you were writing your own function you might add an option for facetting but still maintain the same API:
## define polar plot
polar_plot <- function(.data, x, y, by = NULL) {

  if(!is.null(by)) {
    facet <- facet_wrap(~ .data[[by]])
  } else {
    facet <- NULL
  }

  ggplot(.data, aes(.data[[x]], .data[[y]])) +
    geom_col() +
    coord_polar() +
    facet
}

## works !
polar_plot(msleep, "name", "sleep_total")
## works !
polar_plot(msleep, "name", "sleep_total", by = "vore")
Given the notes around tidyeval above, it’s worth pointing out that the method Dewey used (.data[["variable"]]) does not allow for bare variable names.
Could we use the tunneling approach to do that? Kind of …
## define polar_plot() with tunneling
polar_plot <- function(.data, x, y, by = NULL) {

  if(!is.null(by)) {
    facet <- facet_wrap(~ {{ by }})
  } else {
    facet <- NULL
  }

  ggplot(.data, aes({{x}}, {{y}})) +
    geom_col() +
    coord_polar() +
    facet
}

## works !
polar_plot(msleep, name, sleep_total)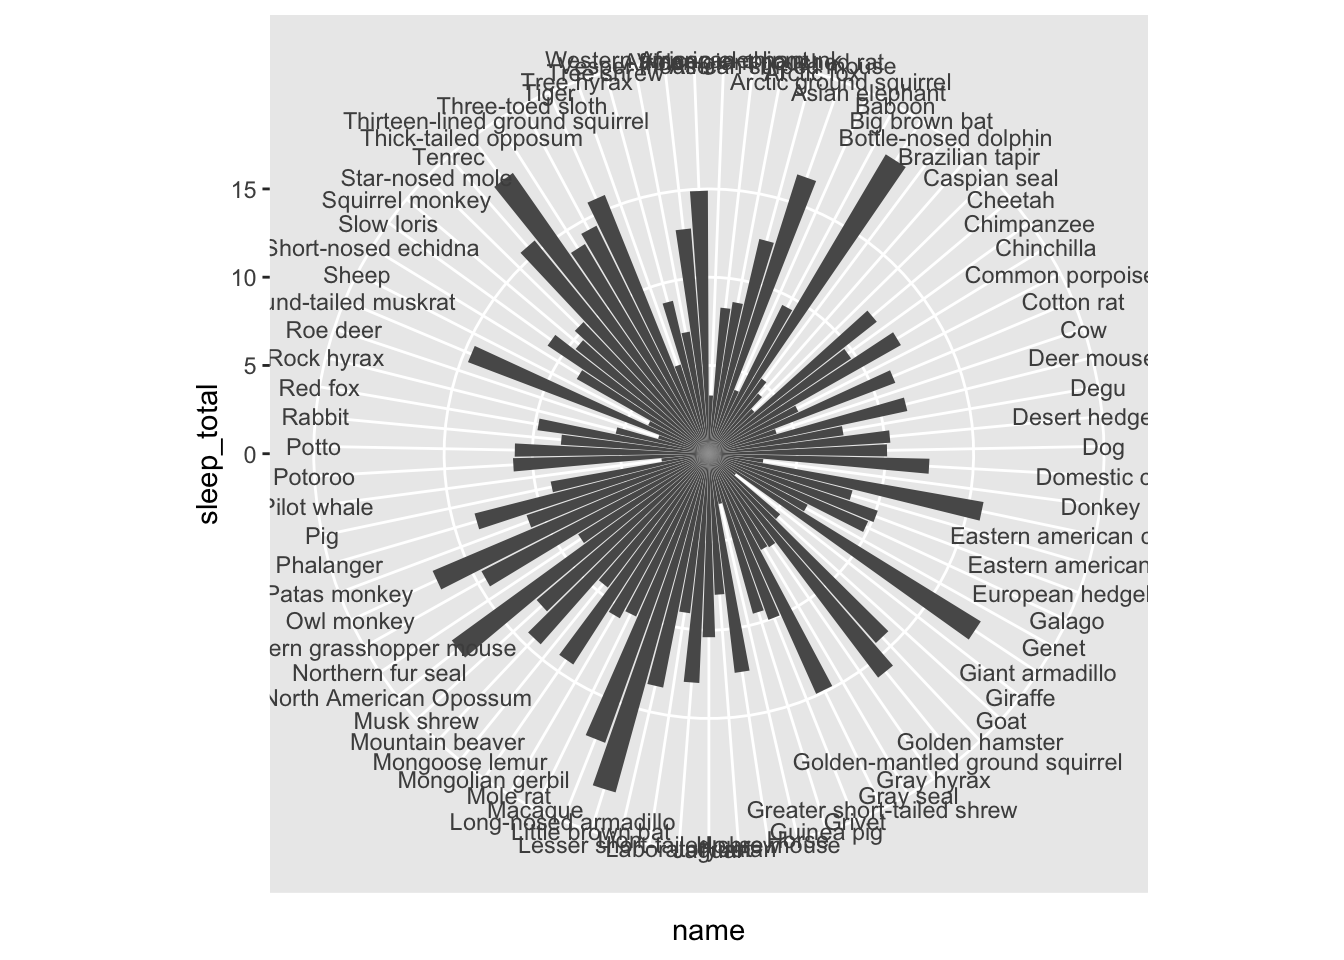
## doesn't work :(
polar_plot(msleep, name, sleep_total, vore)## Error in polar_plot(msleep, name, sleep_total, vore): object 'vore' not foundThe second call to the function doesn’t work. Where is this breaking? if(!is.null(by) … thanks browser()!
To get this working we probably need to dive deeper into quasiquotation. Maybe a topic for another post …
Best practices for programming with ggplot2 - Dewey Dunnington

plumber for building APIs
plumber came up several in several talks.
plumber allows you to create a REST API by merely decorating your existing R source code with special comments.
The example below uses the following procedure:
- Fit a model and save it to an R object
- Write
plumbercode that loads model and defines API endpoints - Run the API locally at port
8000 - Query the API with
curlto return predicted value
library(dplyr)
library(AmesHousing)

ames <- make_ames()

ames_train <-
  ames %>%
  select(Sale_Price, Gr_Liv_Area, Year_Built, Central_Air)

ames_fit <- lm(Sale_Price ~ ., data  = ames_train)
save(ames_fit, file = "ames_fit.rda")
# plumber.R
load("ames_fit.rda")
#* Echo back the input
#* @param msg The message to echo
#* @get /echo
function(msg=""){
list(msg = paste0("The message is: '", msg, "'"))
}
#* Return r squared
#* @get /rsq
function(){
summary(ames_fit)$r.squared
}
#* Return the predicted sale price in dollars
#* @param area The total area of home in square feet
#* @param year The year the home was built
#* @param ac Whether or not the home has Central Air ("Y" or "N")
#* @post /predict
function(area, year, ac){
newdata <-
data.frame(Gr_Liv_Area = as.numeric(area),
Year_Built = as.numeric(year),
Central_Air = ac)
predict(ames_fit, newdata = newdata)[[1]]
}library(plumber)
ames_api <- plumb("plumber.R") # Where 'plumber.R' is the location of the file shown
ames_api$run(port=8000)curl -X POST "http://127.0.0.1:8000/predict?ac=Y&year=1990&area=20000" -H "accept: application/json"Practical Plumber Patterns - James Blair

pins package
pins is a relatively new package for caching and retrieving objects. I heard about it in Alex Gold’s Deploying End-To-End Data Science with Shiny, Plumber, and Pins talk. As he pointed out, pins are good for things you can re-create. The workflow doesn’t necessarily obviate the need for a database / file structure to store data of record. But it can be useful for quickly retrieving model objects or large datasets that are shared across multiple analyses.
library(pins)

## create some sample data
rvalues <-
  data.frame(
    key = sample(LETTERS, size = 1e7, replace = TRUE),
    value = rnbinom(1e7, prob = 0.1, size = 1)
  )

## two concepts: "pins" and "boards"
## pins are data objects
## boards are storage locations

## what board are available
board_list()

## you can also add new boards with board_register_* functions
## e.g. board_register_local(); board_register_s3(); board_register_github()

## here we'll use the "local" board
pin(rvalues, board = "local")
## remove the object from the local environment to prove this is working
rm(rvalues)
## retrieve the object
pin_get("rvalues")
## the above ^ doesn't store it in the environment though
## assign the values to an object
rvalues <- pin_get("rvalues")
Deploying End-To-End Data Science with Shiny, Plumber, and Pins - Alex Gold

bootstraplib package
Joe Cheng introduced a new package called bootstraplib, which is aimed at making it easier to style Shiny app R markdown html output via Sass and CSS variables. There’s also an interactive theming / color picker UI2:
Styling Shiny apps with Sass and Bootstrap 4 - Joe Cheng

rolldown output
Yihui Xie delivered an inspiring blitz through 14 R markdown demos. One of the output formats that was new to me was rolldown, which wraps a “storytelling” format implemented in JavaScript called Scrollama. With this package you can fix output to stay in the center of the html document, while the code and chunks of text scroll down the side. The package includes a vignette with this sidebar layout as an example.
Another bonus for me was learning about rmarkdown::draft(). This function stubs out an R markdown document from scratch or from a template:
## stub out templated rolldown file
rmarkdown::draft("draft.Rmd",
                 template = "scrollama-sidebar",
                 package = "rolldown",
                 edit = FALSE)

## stub out templated rolldown file AND interactively edit
rmarkdown::draft("draft2.Rmd",
                 template = "scrollama-sidebar",
                 package = "rolldown",
                 edit = TRUE)
One R Markdown Document, Fourteen Demos - Yihui Xie

Image borrowed from
boostraplibREADME↩