I’ve found myself on Winston Chang’s cookbook-r website a number of times before. My most recent visit was to refresh my memory on the strategy for plotting means with error bars with ggplot2:
http://www.cookbook-r.com/Graphs/Plotting_means_and_error_bars_(ggplot2)
The recipe makes use of summarySE() a function that is described in detail in another post that details strategies for summarizing data.
summarySE() is a custom function that computes the mean, standard deviation, count, standard error, confidence interval for a variable (“measurevar”) within defined grouping variables (“groupvars”).
Below is the code for the function, along with a working example of how to use it with the built-in “ToothGrowth” dataset (?ToothGrowth).
## Summarizes data.
## Gives count, mean, standard deviation, standard error of the mean, and confidence interval (default 95%).
##   data: a data frame.
##   measurevar: the name of a column that contains the variable to be summarized
##   groupvars: a vector containing names of columns that contain grouping variables
##   na.rm: a boolean that indicates whether to ignore NA's
##   conf.interval: the percent range of the confidence interval (default is 95%)
summarySE <- function(data=NULL, measurevar, groupvars=NULL, na.rm=FALSE,
                      conf.interval=.95, .drop=TRUE) {
    library(plyr)

    # New version of length which can handle NA's: if na.rm==T, don't count them
    length2 <- function (x, na.rm=FALSE) {
        if (na.rm) sum(!is.na(x))
        else       length(x)
    }

    # This does the summary. For each group's data frame, return a vector with
    # N, mean, and sd
    datac <- ddply(data, groupvars, .drop=.drop,
      .fun = function(xx, col) {
        c(N    = length2(xx[[col]], na.rm=na.rm),
          mean = mean   (xx[[col]], na.rm=na.rm),
          sd   = sd     (xx[[col]], na.rm=na.rm)
        )
      },
      measurevar
    )

    # Rename the "mean" column
    datac <- rename(datac, c("mean" = measurevar))

    datac$se <- datac$sd / sqrt(datac$N)  # Calculate standard error of the mean

    # Confidence interval multiplier for standard error
    # Calculate t-statistic for confidence interval:
    # e.g., if conf.interval is .95, use .975 (above/below), and use df=N-1
    ciMult <- qt(conf.interval/2 + .5, datac$N-1)
    datac$ci <- datac$se * ciMult

    return(datac)
}head(ToothGrowth)## len supp dose
## 1 4.2 VC 0.5
## 2 11.5 VC 0.5
## 3 7.3 VC 0.5
## 4 5.8 VC 0.5
## 5 6.4 VC 0.5
## 6 10.0 VC 0.5summarySE(ToothGrowth,
measurevar="len",
groupvars=c("supp","dose"),
conf.interval = 0.9)## supp dose N len sd se ci
## 1 OJ 0.5 10 13.23 4.459709 1.4102837 2.585209
## 2 OJ 1.0 10 22.70 3.910953 1.2367520 2.267106
## 3 OJ 2.0 10 26.06 2.655058 0.8396031 1.539087
## 4 VC 0.5 10 7.98 2.746634 0.8685620 1.592172
## 5 VC 1.0 10 16.77 2.515309 0.7954104 1.458077
## 6 VC 2.0 10 26.14 4.797731 1.5171757 2.781154tidyeval approach
The cookbook-r site includes several solutions to the “Summary SE” problem. The summarySE() function (above) works well, and includes comments explaining each parameter. However, given my inexperience with plyr I find the code a little hard to understand … or at least harder than if it were written with dplyr. I decided to try to translate summarySE() into a syntax that I could use in a pipeline with %>%. To do so, I needed to learn a little about the tidyeval framework and its programming paradigm.
The code for the new function (summary_se()) is below, along with the same ToothGrowth example as above.
A few notes from my exploration:
enquo()captures the bare variable name, and!!in a subsequentdplyrcall will reference that variableenquos()and!!!work in a similar matter but can capture multiple variable names passed in via...- It’s good practice to prefix argument names with
.when writing functions that usetidyeval… the reason being that it is not likely that a user would have an existing column name that starts with.
summary_se <- function(.data, measure_var, ..., .ci = 0.95, na.rm = FALSE) {

  measure_var <- dplyr::enquo(measure_var)
  group_var <- dplyr::enquos(...)

  .data %>%
    group_by(!!! group_var) %>%
    summarise(mean = mean(!! measure_var, na.rm = na.rm),
              sd = sd(!! measure_var, na.rm = na.rm),
              n = n(),
              se = sd/sqrt(n),
              ci = se * qt(.ci/2 + 0.5, n-1)) %>%
    ungroup()

}
library(dplyr)
library(ggplot2)
ToothGrowth %>%
summary_se(len, supp, dose, .ci = 0.9)## # A tibble: 6 x 7
## supp dose mean sd n se ci
## <fct> <dbl> <dbl> <dbl> <int> <dbl> <dbl>
## 1 OJ 0.5 13.2 4.46 10 1.41 2.59
## 2 OJ 1 22.7 3.91 10 1.24 2.27
## 3 OJ 2 26.1 2.66 10 0.840 1.54
## 4 VC 0.5 7.98 2.75 10 0.869 1.59
## 5 VC 1 16.8 2.52 10 0.795 1.46
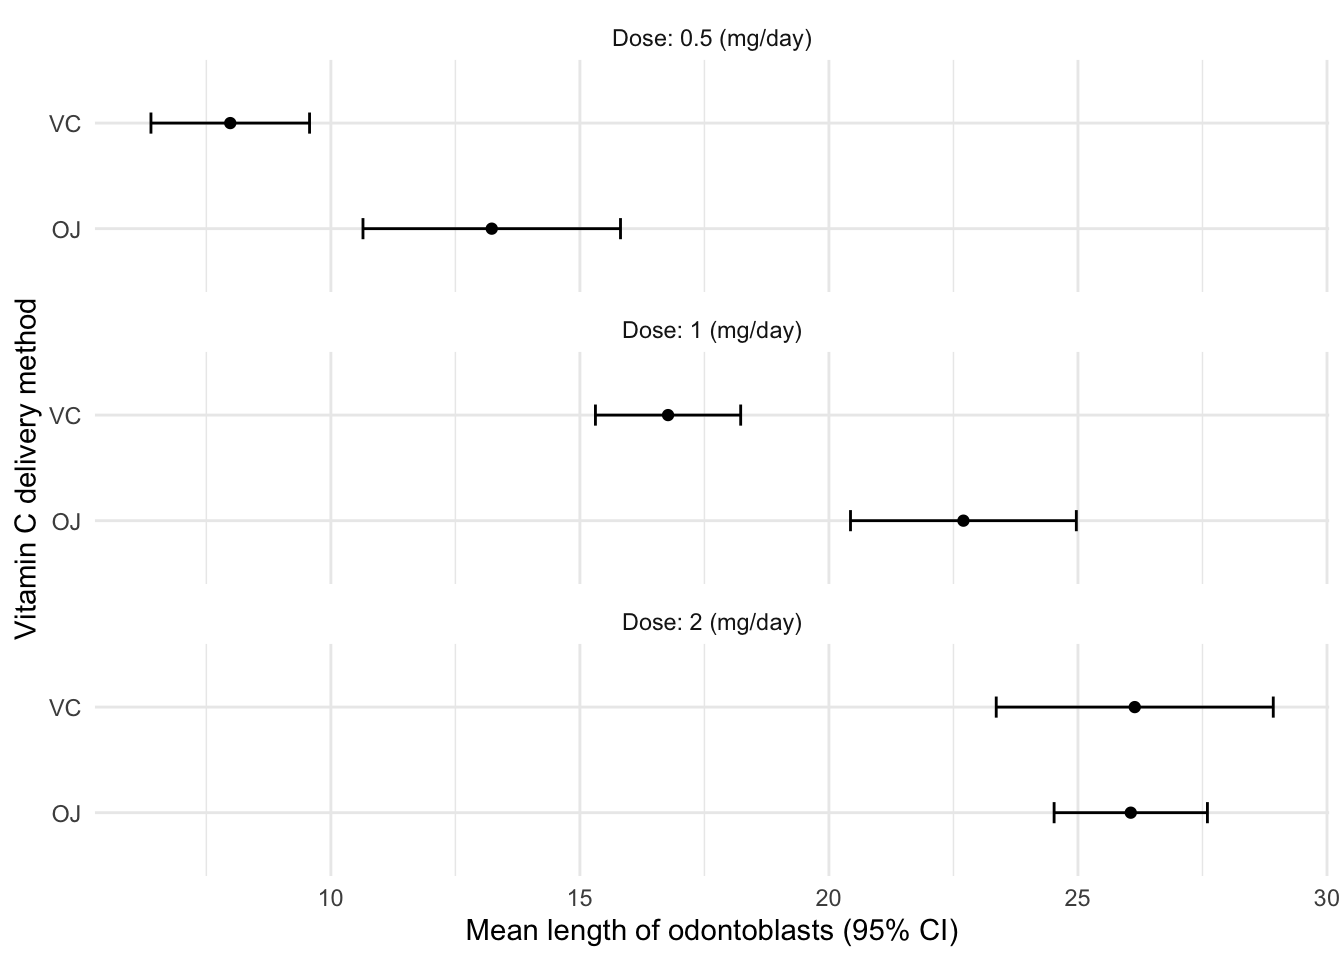
## 6 VC 2 26.1 4.80 10 1.52 2.78ToothGrowth %>%
summary_se(len, supp, dose, .ci = 0.9) %>%
mutate(dose = paste0("Dose: ", dose, " (mg/day)")) %>%
ggplot(aes(supp,mean)) +
geom_point() +
geom_errorbar(aes(ymin = mean - ci,
ymax = mean + ci),
width = 0.2) +
labs(x = "Vitamin C delivery method", y = "Mean length of odontoblasts (95% CI)") +
coord_flip() +
facet_wrap(~ dose, ncol = 1) +
theme_minimal()