TL;DR
The tabulizer R package allows you extract tables from PDFs. It requires Java dependencies. To use the package via a Docker container:
docker pull vpnagraj/tabulizer
mkdir output
# table of interest is on page 5 of some.pdf
infile=some.pdf
docker run -ti \
-v $(pwd)/$infile:/$infile \
-v $(pwd)/output:/output vpnagraj/tabulizer $infile 5
Avoidance of dependency hell can motivate folks to move towards containerization. I recently experienced (admittedly minor) frustration with installing dependencies for an R workflow. I had read about the tabulizer R package, which serves as a set of bindings for the tabula PDF table extractor Java library. The documentation for tabulizer explains that Mac OS users need a particular version of Java. I wanted to try the package but preferred not to install the recommended (but deprecated) version of Java. So instead, I put together a workflow using Docker to:
- Containerize all of the necessary software
- Script the container image to run R code that calls functions from the
tabulizerpackage - Specify the Docker “Entrypoint” such that I could pass in a
.pdffile and page number with a table to be extracted
The code below includes the Dockerfile and instructions to build the container. Alternatively the image is on DockerHub.
Dockerfile
The Docker image first pulls the latest version of the r-base image, then installs Java dependencies and R package. The commands also make an output/ directory (to be mapped to a local equivalent on the host during docker run) and copies the run.R script from the local machine into the container. Finally, the uses ENTRYPOINT to run a command when the container is executed.
FROM r-base:latest

RUN apt-get -y update && apt-get install -y \
   default-jdk \
   r-cran-rjava

RUN Rscript -e "install.packages(c('tabulizer'), repos = 'http://cran.rstudio.com')"

# create output directory
RUN mkdir output

# move run script in
COPY ./run.R /

ENTRYPOINT ["Rscript","--vanilla", "run.R"]
run.R
The run.R script is copied into the Docker image when built. When the container is run, the script is executed. The code parses the two command line arguments (first is the location of the .pdf file, second is the page that contains the table). The code writes the parsed table to a .csv file.
library(tabulizer)

arguments <- commandArgs(trailingOnly = TRUE)

f <- arguments[1]
p <- arguments[2]

tab <- extract_tables(f,p)

if(is.list(tab) && !is.data.frame(tab)) {

  tab <- tab[[1]]

}

out_path <- paste0("output/",tools::file_path_sans_ext(f), "_", p, ".csv")

res_out <- try(write.csv(tab, file = out_path, row.names = FALSE))

if(is.null(res_out)) {

  message(
    sprintf("%s parsed and written to %s (%d)",
            f,
            out_path,
            nrow(tab)
            )
    )

} else {

  message(res_out)

}
Building the image
To build the image first clone the GitHub repository that contains the image code:
git clone https://github.com/vpnagraj/tabulizer-docker.gitMake sure run.R has appropriate permissions to be executed:
cd tabulizer-docker
chmod+x run.R
Build the image:
docker build -t --no-cache vpnagraj/tabulizer .Alternatively you can pull the existing image from DockerHub:
docker pull vpnagraj/tabulizerRunning
To run the image you can first make sure you’ve created a directory for the output next to the .pdf file you’ll parse:
mkdir outputNext (optionally) set a variable to the input file to parse (a PDF called some.pdf in this example):
infile=some.pdfNow run the container … in this case we want the table that’s on page 5 of some.pdf
docker run -ti -v $(pwd)/$infile:/$infile -v $(pwd)/output:/output vpnagraj/tabulizer $infile 5If successful, the output will be in .csv format at output/some_5.csv
Example
Here is a scenario …
The May 2019 CDC Vital Statistics Rapid Release includes data regarding births in the United States from 2017 and 2018:
https://www.cdc.gov/nchs/data/vsrr/vsrr-007-508.pdf
Page 15 features a table of the rate of preterm birth by state.
Assuming I have the PDF above downloaded and the tabulizer Docker container available, I could run the following (from the directory that holds the .pdf):
mkdir output
infile=vsrr-007-508.pdf
docker run -ti \
-v $(pwd)/$infile:/$infile \
-v $(pwd)/output:/output vpnagraj/tabulizer $infile 15library(tidyverse)
preterm <-
# skip mostly empty rows and ignore overall US values
read_csv("output/vsrr-007-508_15.csv",
skip = 4) %>%
select(State = 1, `2018` = 7, `2017` = 9)
preterm %>%
head(10)## # A tibble: 10 x 3
## State `2018` `2017`
## <chr> <dbl> <dbl>
## 1 Alabama 12.5 12.0
## 2 Alaska 9.26 8.98
## 3 Arizona 9.51 9.27
## 4 Arkansas 11.6 11.4
## 5 California 8.79 8.68
## 6 Colorado 9.22 8.76
## 7 Connecticut 9.36 9.48
## 8 Delaware 9.55 10.2
## 9 District of Columbia 10.1 10.6
## 10 Florida 10.2 10.2preterm %>%
# no dc ...
filter(State != "District of Columbia") %>%
gather(year,value,`2018`:`2017`) %>%
mutate(value = value/100) %>%
ggplot(aes(year, value, group = State)) +
geom_point() +
geom_line() +
scale_y_continuous(labels = scales::percent_format(accuracy = 1)) +
labs(x = NULL,
y = "% infants born preterm",
title = "Rate of Preterm Birth by State") +
facet_wrap(~ State, ncol = 10) +
theme_bw() +
theme(text = element_text(size = 7))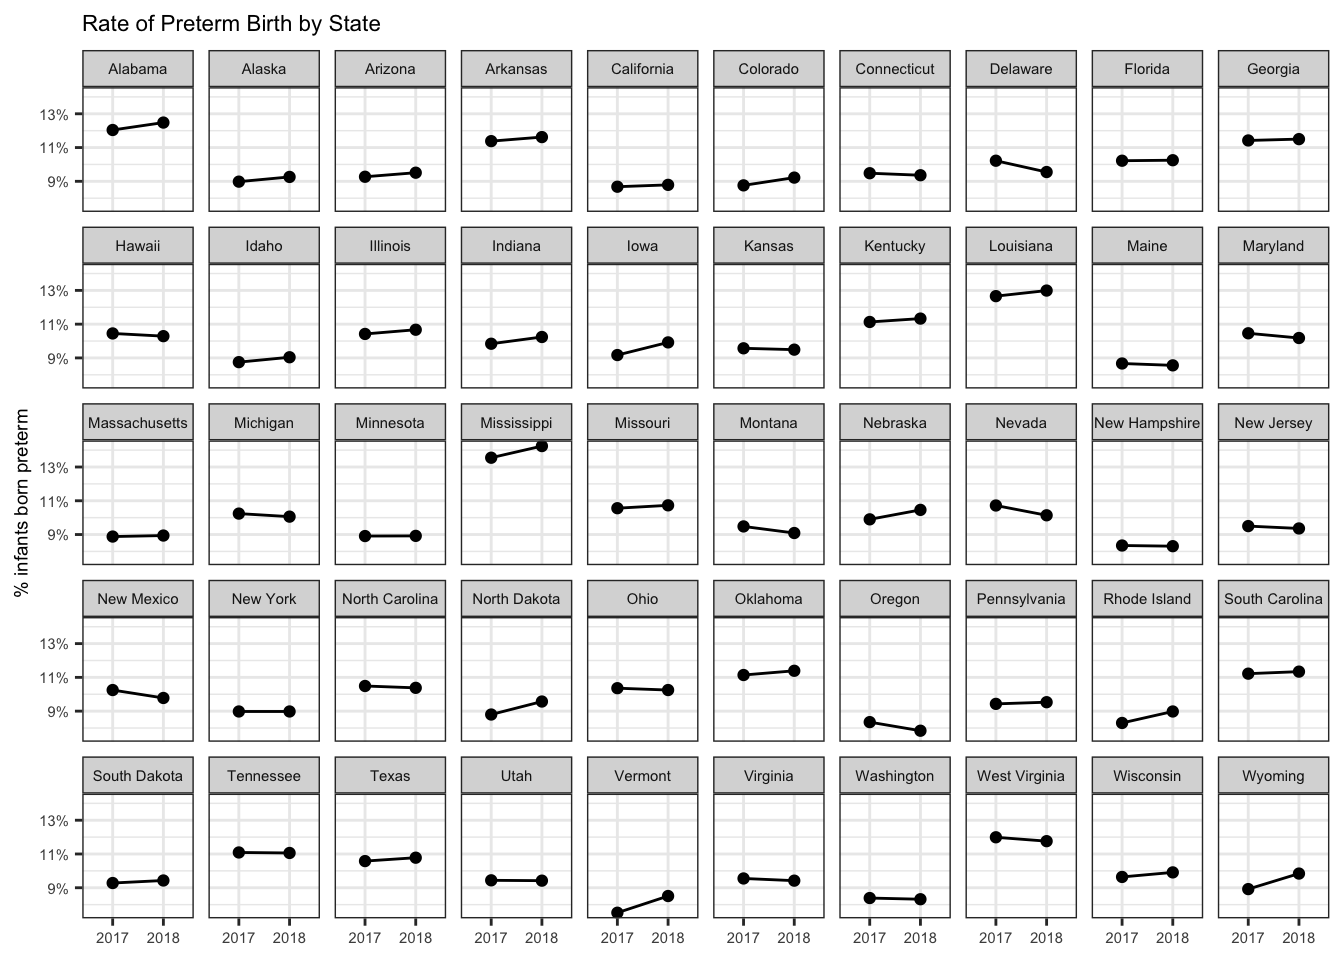
The data above was acquired from the CDC National Center for Health Statistics. The report states that all material is in the public domain and may be reproduced or copied without commission.
Hamilton BE, Martin JA, Osterman MJK, Rossen LM. Births: Provisional data for 2018. Vital Statistics Rapid Release; no 7. Hyattsville, MD: National Center for Health Statistics. May 2019.